Bitcoin Mirrors 2021 Structure at $30K Base, Bullish Breakout Now in Play

Bitcoin mimics its 2021 setup, with support at $30K signaling a bullish base.
Analyst charts show repeated cycle phases hinting at a $210K breakout path.
Market phases reveal a shift from manipulation to bullish distribution zones.
Bitcoin’s present timespan mirrors its 2021 pattern, repeating a potential breakout above $30,000. Technical analysts cite repeated levels of support and emotional cycles signifying a new move higher in price.
Chart Patterns Reveal Familiar Market Setup
Bitcoin is currently stabilizing around a key support zone, previously marked during the 2021 consolidation phase. Historical patterns indicate strong rallies following this structure, especially when support holds despite market corrections. Price action suggests that similar technical behavior may drive the next bullish leg.
Recent activity highlights a striking resemblance to Bitcoin’s 2021 pattern before it surged from $30,000 to $60,000. Technical analyst Lofty has presented an analysis of the 2021 and 2025 time frames, focusing on price structure and key zones. According to Lofty, Bitcoin formed a strong base near $29,000 in 2021 before rallying sharply.
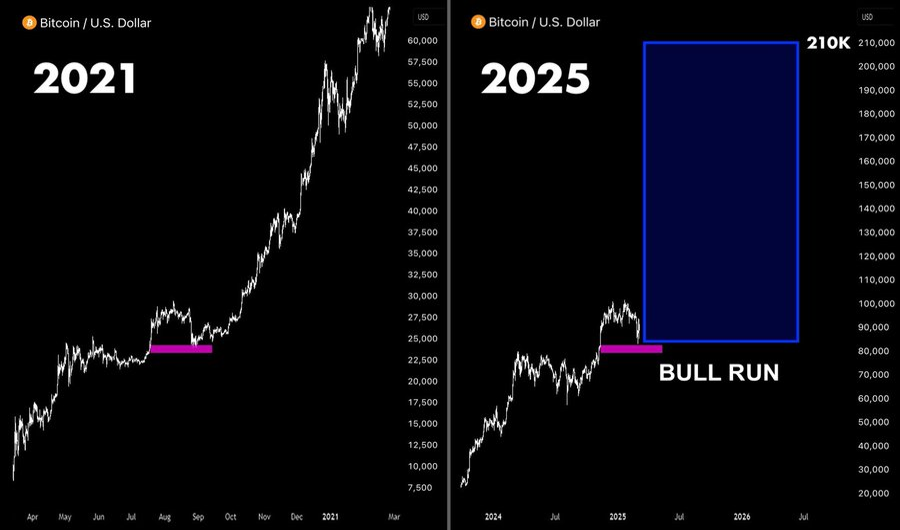
Source: Lofty
In his view, 2025 price action mirrors this earlier setup with another base around the same support range. He marked this level with a magenta zone in both time frames, identifying it as the foundation for a potential breakout. His projection places the next peak near $210,000, illustrated by a blue box aligned with historical momentum.
Besides time frame symmetry, Lofty identified repeated four-year cycle phases that reinforce this setup. He also outlined investor behavior across accumulation, markup, distribution, and decline. According to this breakdown, current activity aligns with early markup, following accumulation and shakeout.
He further emphasized psychological stages from optimism to capitulation, noting that the present moment reflects renewed optimism. Based on this sequence, he expects increasing market confidence to drive further gains. This matrix model connects altcoin movement with Bitcoin dominance shifts and price changes, suggesting upcoming alt rallies.
Blueprint Highlights Market Manipulation Structure
Analyst Merlijn The Trader has provided additional insights focusing on price manipulation phases and institutional behavior. His framework divides recent Bitcoin price activity into accumulation, manipulation, and distribution zones. Each segment reflects unique price reactions and trading behavior.
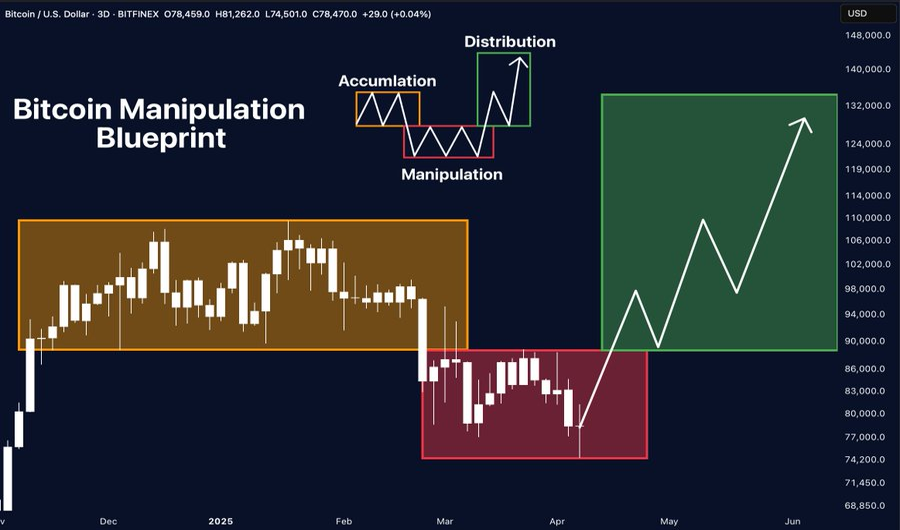
Source: Merlijn The Trader
According to Merlijn, Bitcoin consolidated between $85,000 and $90,000 from November to February, forming the accumulation range. In March, the price dropped sharply to $74,000, creating a manipulation zone characterized by panic and stop-loss triggers. He marked this breakdown in red, identifying it as a deliberate shakeout phase.
A strong rebound occurred in April as Bitcoin broke back into its previous range with a large bullish candle. This move transitioned the price into a distribution phase, where targets extend toward $132,000. Merlijn’s structure outlines how price phases correspond to emotional cycles and institutional strategies.